I can understand how pie charts can be manipulated to show whatever the presenter wants to show...
However I fail to see how they are lying because they used a pie chart... back in 2008 they are saying that Apple had roughly 20% of the market share of smart phones.
They are vague in explaining whether they are measuring - devices sold, devices in use, devices pre-ordered... however that would be the case whether they used a bar graph, line graph, or just gave the raw numbers.
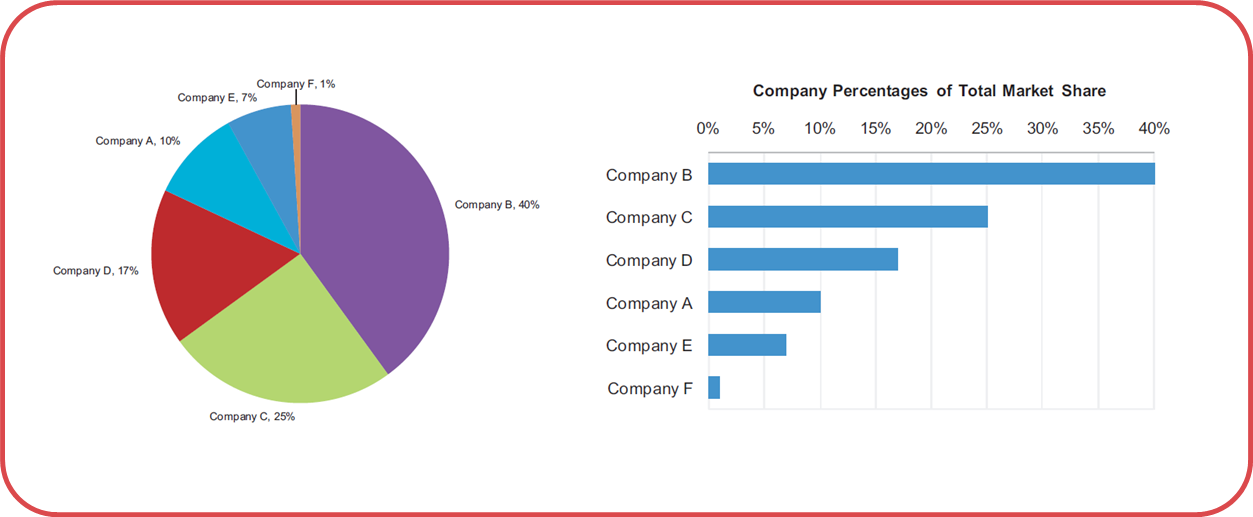
Here's an experiment: Get a random set of pie charts without labels on them. Get a large group of people. Now get those people to go through the pie charts and add what % of the pie chart they think each slice represents.
Now, get a set of bar charts and do the same thing.
In both experiments time the participants. You'll need two groups, a group that knows they're being timed and one that doesn't know.
What group was more accurate? What group was able to complete the exercise faster?
The reason that using pie charts is, in and of itself, a dark pattern is because the results of this experiment support bar charts as a more concise, more easily understood way of communicating information. In other words, the only real reason you'd use a pie chart is to obfuscate information. Or, well... to lie. If you're just using it because you don't know better, then you're negligent and misleading people without even knowing it.
"then you're negligent and misleading people without even knowing it."
Is that their fault? I don't entirely think so. You might be able to claim they should have done the research before choosing that type of graph but the majority of people are not even going to give pie charts a second thought.
If there was an active campaign against pie charts and more discussion I might find fault in that persons ignorance to the matter.
However I fail to see how they are lying because they used a pie chart... back in 2008 they are saying that Apple had roughly 20% of the market share of smart phones.
They are vague in explaining whether they are measuring - devices sold, devices in use, devices pre-ordered... however that would be the case whether they used a bar graph, line graph, or just gave the raw numbers.